Parent Functions, Domain, and Range:
Definitions:
• Quadratic function: is a function that can be written in the form
f(x) = ax2 + bx + c
where a, b, and c are real numbers and a 6= 0.
• Parabola: The graph of a squaring function is called a parabola. It is a U-shaped graph.
• Vertex of a parabola: The point on the parabola where the graph changes direction. It is the
lowest point if a > 0, and it is the highest point if a < 0.
The axis of symmetry is also known as (-h) and the vertex is also known as (-h,k)
• Quadratic function: is a function that can be written in the form
f(x) = ax2 + bx + c
where a, b, and c are real numbers and a 6= 0.
• Parabola: The graph of a squaring function is called a parabola. It is a U-shaped graph.
• Vertex of a parabola: The point on the parabola where the graph changes direction. It is the
lowest point if a > 0, and it is the highest point if a < 0.
- Equation: y = x2 (x squared)
- Domain: All real numbers
- Range: All real numbers greater than or equal to 0. (y ≥ 0)
- y-intercept: (0,0)
- x-intercept: (0,0)
- Line of symmetry: (x = 0)
- Vertex: (0,0)
The axis of symmetry is also known as (-h) and the vertex is also known as (-h,k)
|
|
|
|
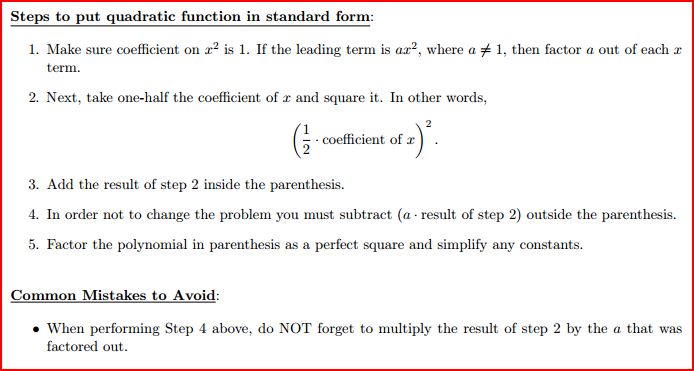
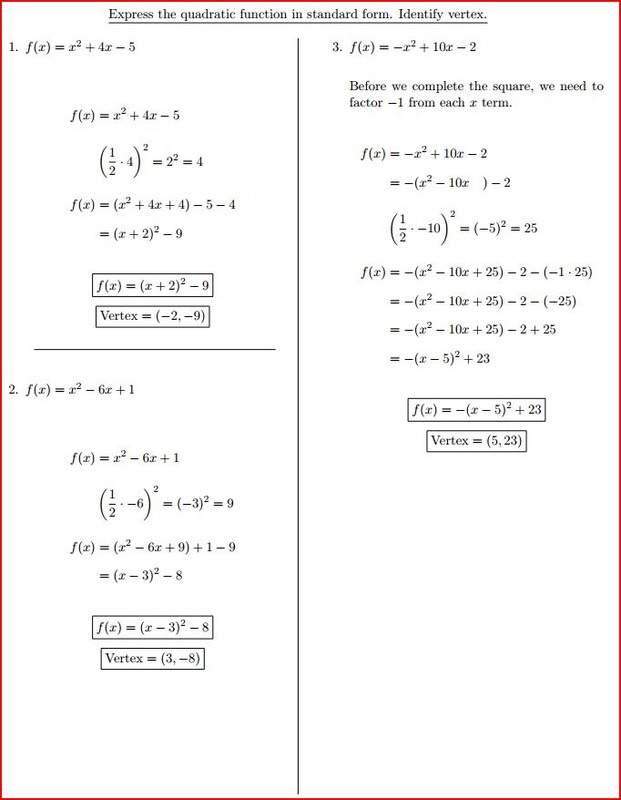
Standard Form
Example(s):
|
Vertex FormY-intercept/Roots: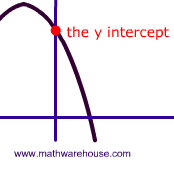
|
Types Of Translations:
Horizontal:A horizontal translation moves the graph left or right. if y = f(x), then y = f(x-h) gives a vertical translation. The translation h moves the graph to the left when h is a postive value and to the right when h is negative value.
Dilation:A dilation is a transformation which preserves the shape and orientation of the figure, but changes its size. The scale factor of a dilation is the factor by which each linear measure of the figure (for example, a side length) is multiplied.
The figure below shows a dilation with scale factor 2, centered at the origin. 
This dilation can be described in coordinate notation as . (Again, you can check this by plugging in the coordinates of each vertex.)
|
Vertical:A vertical translation moves the graph up or down. If y = f(x), then y = f(x) + k gives a vertical translation. The translation k moves the graph upward when k is a postive value and downward when k is negative value.
Reflections:The figure below shows triangle ABC reflected across the line y = x + 2.
This reflection can be described in coordinate notation as . (Again, you can check this by plugging in the coordinates of each vertex.)
|
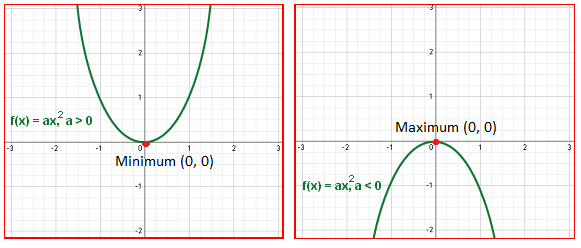
Minimum/Maximum:
|
The graph of a quadratic function opens upward when the leading coefficient a > 0.
In that case, the vertex is the minimum point on the graph. That is, there is no other point on the graph whose y-value is lower. |
The graph of a quadratic function opens downward when the leading coefficient a < 0.
In that case, the vertex is the maximum point on the graph. That is, there is no other point in the graph whose y-value is higher. |